Condition of Education Reports
Read our Q&A with Jijun Zhang, senior research analyst at AIR.
How has the U.S. education system changed over time? What are the characteristics of students and teachers? How does the U.S. education system compare with others around the world?
The Condition of Education provides data and information on these questions and much more. The report aims to help the public and policymakers understand the current state of education and where there might be room for improvement—as well as monitor educational progress over time.
About the Report
- What: The Condition of Education is a congressionally mandated report that paints a picture of the state of education in the U.S. from early childhood through postsecondary education. It includes more than 45 indicators and comprehensive data about students, teachers, principals, schools, assessments, finances, labor force outcomes of young adults, international comparisons, and more.
Four Major Categories of Indicators in The Condition of Education
- Preprimary, elementary, and secondary education
- Postsecondary education
- Population characteristics and economic outcomes
- International comparisons
- Who: The report is produced by the National Center for Education Statistics, and AIR serves as lead developer.
- When: The Condition of Education is released annually in the spring. The first report came out in 1975.
Related Infographics
From the 2020 Report:

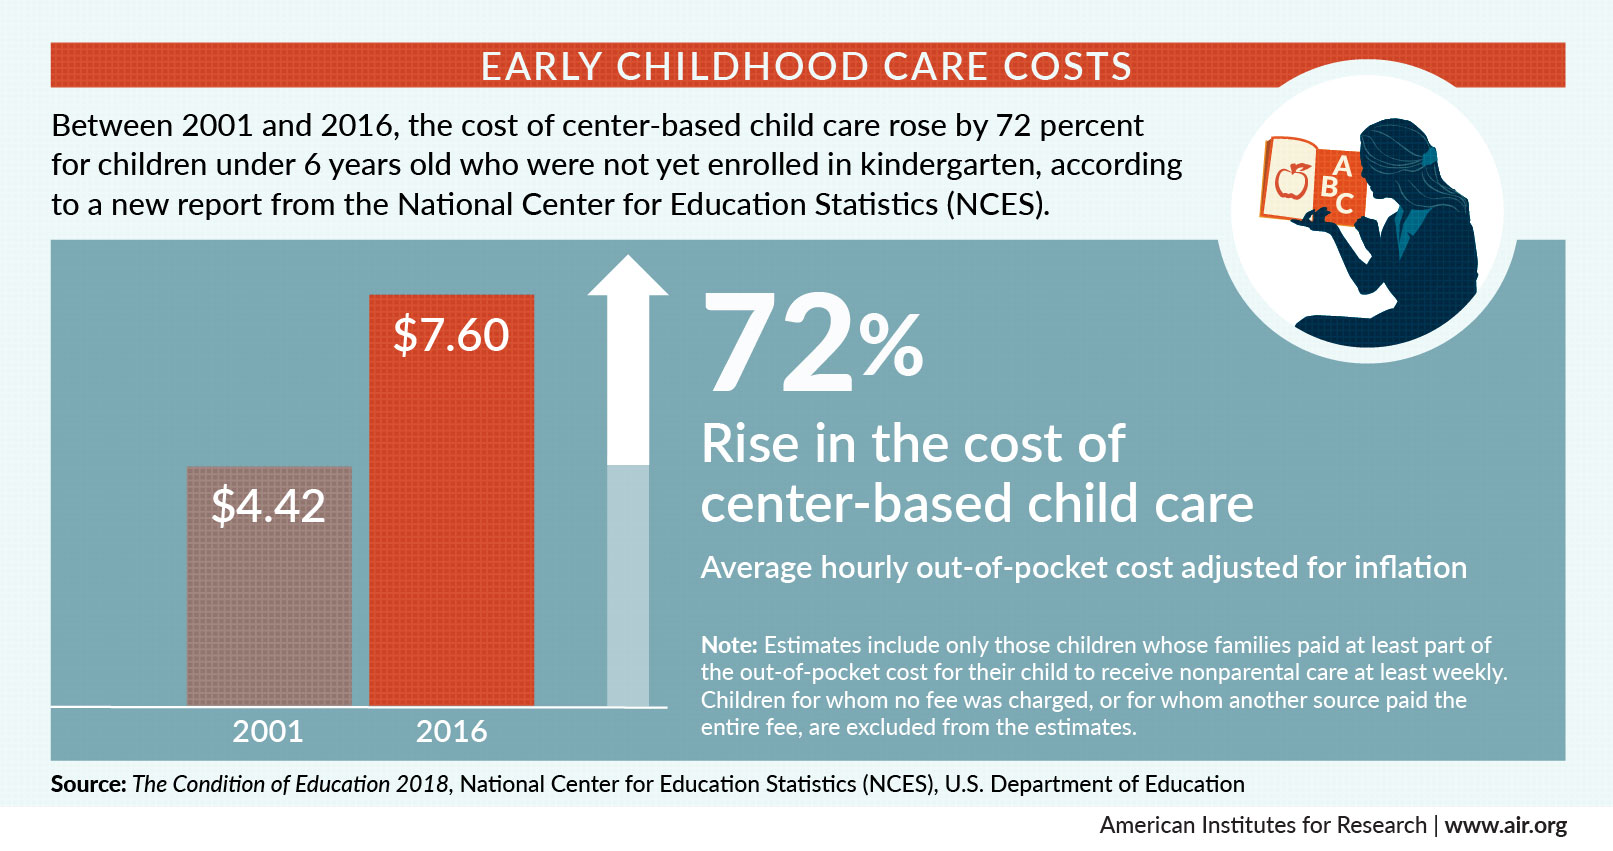
From the 2018 Report:
From the 2016 Report:
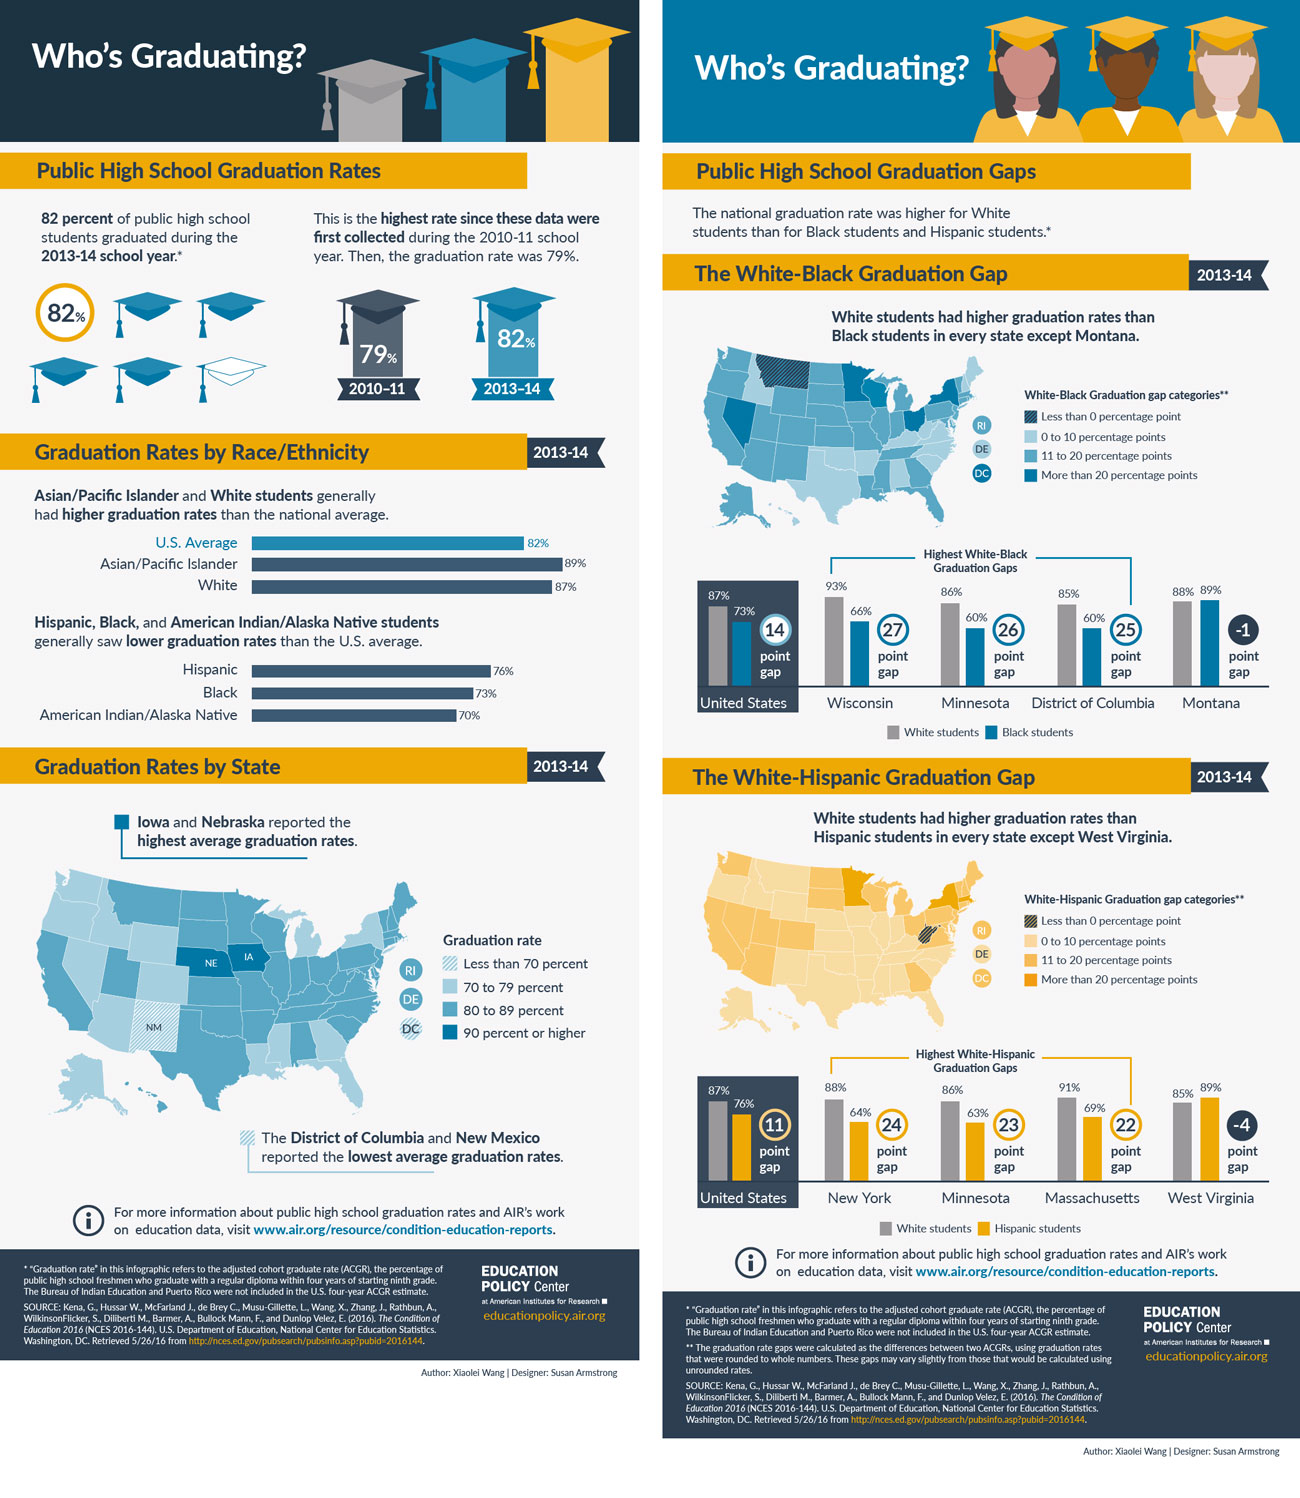
How much do we know about who’s graduating? These full-page infographics show graduation rates—and graduation gaps—for all 50 states.
View full-size PDF versions of the infographics below: Graduation Rates and Graduation Gaps >>