What Educators Need to Know About Students’ Mathematics and Science Achievement
U.S. fourth- and eighth-grade students made long-term achievement gains in mathematics, but not in science, according to the U.S. results on the 2019 Trends in International Mathematics and Science Study (TIMSS). What do these trends tell us about what’s happening in U.S. schools and classrooms—and how can educators make practical use of the results? In this Q&A, AIR’s Tad Johnston, senior technical assistant consultant and a mathematics education specialist, and Danielle Ferguson, senior researcher and a science education specialist, offer their insights.
TIMSS is an international comparative study that measures trends in mathematics and science achievement in the fourth and eighth grades every four years. AIR experts provide technical and analytical support for U.S. participation in TIMSS.
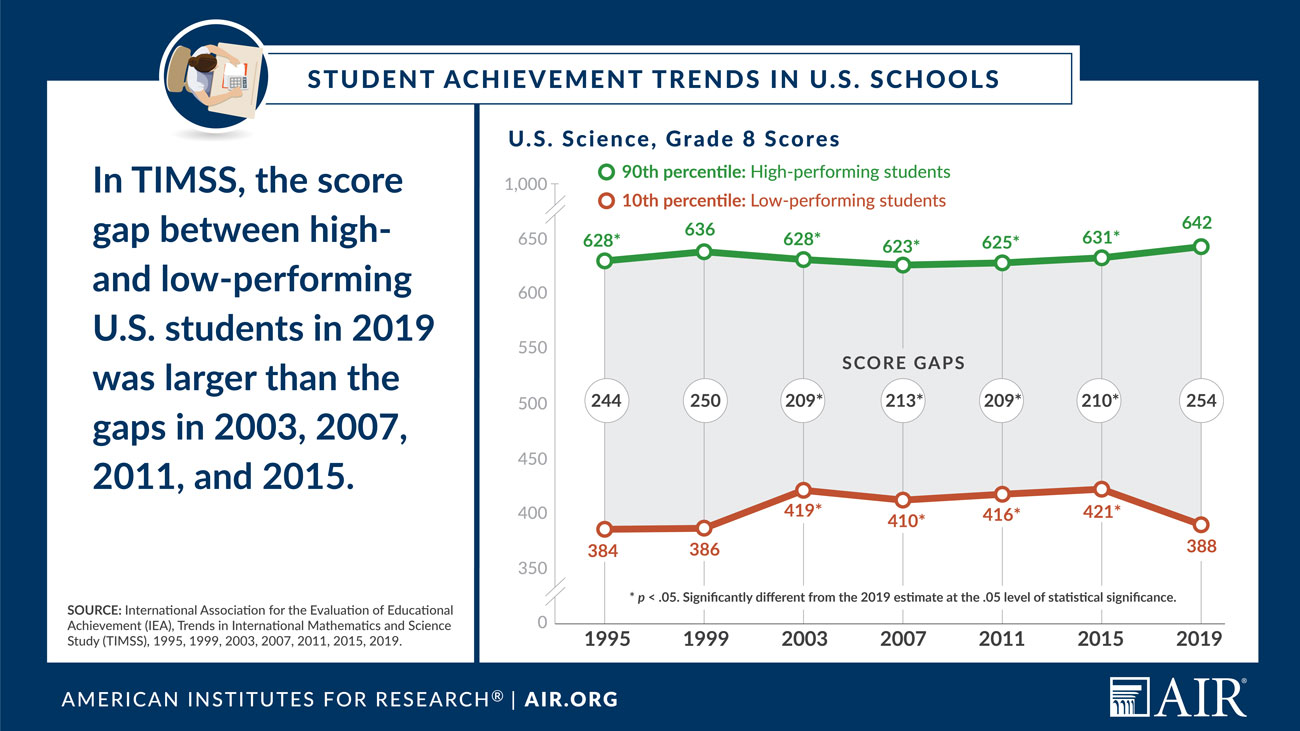
While the U.S. had higher average scores in 2019 than most participating countries in both mathematics and science at both the fourth and eighth grades, there were relatively large score gaps between the high- and low-performing students in both subjects and grades. This gap is measured by the difference between the scores of students in the 90th and 10th percentiles of the distribution—and it can be one indication of equity within an education system.
Mathematics Highlights
- The U.S. ranked 15th among the 64 participating education systems in average fourth-grade TIMSS mathematics scores, and 11th in average eighth-grade scores among the 46 participating education systems.
- Only nine education systems had a higher percentage of fourth-graders reaching the Advanced international benchmark for mathematics proficiency than the U.S., and only seven education systems had a higher percentage of eighth-graders reaching this level of achievement.
- The score gap between the high- and low-performing U.S. fourth-graders on the TIMSS mathematics scale was larger than the gaps in 37 education systems. For eighth-graders, the U.S. score gap was larger than the gaps in 31 education systems.
- The U.S. ranked 8th among the 64 participating education systems in average fourth-grade TIMSS science scores, and 11th in average eighth-grade science scores among the 46 participating education systems.
- Only five education systems had a higher percentage of fourth-graders reaching the Advanced international benchmark for science proficiency than the U.S., and only six education systems had a higher percentage of eighth-graders reaching this level of achievement.
- The score gap between the high- and low-performing U.S. fourth-graders on the TIMSS science scale was larger than the gaps in 37 education systems. For eighth-graders, the U.S. score gap was larger than the gaps 24 education systems.
Q. Compared with most of the participating education systems, the U.S. had higher average mathematics scores on TIMSS in 2019. Overall, mathematics scores in both fourth and eighth grades have increased since TIMSS was first administered in 1995—although they haven’t changed significantly since 2015. Why do you think this has happened?
Johnston: There’s been a greater U.S. emphasis in the last 25 years on math education. All states have worked on improving their math standards, curricula, and assessments. Recent research on how students learn mathematics has been translated in many places into practical applications to improve instructional methods.
The big jump in scores in both grades seems to have occurred from 1995 to 2007 or 2011, so we made more progress earlier than we have recently. So the question is, what’s happened for the past eight years?
I think the results indicate that much of what we’re doing is working well for some students. The top-achieving eighth-graders in the U.S. are scoring increasingly higher on TIMSS in recent years—and similar trends in mathematics have been observed in the National Assessment of Educational Progress (NAEP). But it is not enough that just our top achievers are performing at higher levels. The increasing achievement gap points to inequitable opportunities to learn and has serious implications for the workforce now and in the future. The message for classroom teachers is that we need to find different methods and resources to raise the achievement of learners not yet successful in math, especially those from traditionally underserved groups: students of color, multilanguage learners, and those from economically disadvantaged backgrounds.

Q. In science, the U.S. had higher average TIMSS scores in 2019 than most participating education systems. Overall, science scores in both fourth and eighth grades are not significantly different than they were in 1995. And for fourth-graders, average science scores actually decreased slightly since 2015. Why aren’t U.S. students making progress in science over time?
Ferguson: The scores let us know there’s still a lot of work to do. I think there are a couple of reasons why U.S. students haven’t made significant progress over time. We still don’t have a national set of science standards. Most states have adopted or created standards based on the National Research Council’s Framework for K–12 Science Education or Next Generation Science Standards.
Changing the standards alone is not enough, however. For example, the Next Generation Science Standards call for more inclusion of engineering practices, more technology integration, more inclusiveness—in other words, science for all. But this doesn’t lead to more resources in under-resourced schools for students to participate in engineering activities. There’s no real curriculum for the standards. This means that science instruction looks different across the states. The resources and details for learning science as it relates to diversity, equity, and inclusion is still an area that needs to be improved. I definitely think that we really need to consider who science is for, because not only are there gaps between white and African American and Hispanic students—well, that’s always been—but now the gap is even wider based on poverty levels, and the difference is extreme.
We also still see remnants of No Child Left Behind, which established state accountability for student proficiency in math and reading. There’s still a lot of pressure, especially at the elementary levels, for teachers to focus more on math and reading. So science, in some cases, is secondary to those subjects in terms of instructional time.
Q. There are some troubling trends over time, with U.S. scores decreasing among the bottom-performing students compared to previous years. What might explain these findings?
Johnston: Looking at the data, our position in the world is better for our higher-performing students in math than it is for our overall average.
Compared with 2011, the 2019 math scores of our 90th- and 75th-percentile students have gone up in grade eight. But since 2015 they’ve gone down at both the 25th and the 10th percentiles—and our 10th-percentile students are actually back to 1995 levels. And in 2019, the gap between our top-performing and lowest-performing students in grade eight is the largest gap ever. In recent years, there is a similar pattern in grade four in terms of decreasing scores for students in the 10th percentile, but no significant change in scores over time for students in the 90th percentile. This pattern is mirrored in NAEP scores. There are also dismayingly wide gaps in scores by race, ethnicity, and school poverty.
There are several possible explanations. The changes in U.S. scores may be due to variability in programs of study, units of instruction, and materials used across states, districts, and schools.
Compared to other countries, we don’t have a national curriculum or national curriculum materials. Look at Singapore, the top-performing country in math. Many years ago, Singapore used the ideas of the U.S. National Council of Teachers of Mathematics Curriculum and Evaluation Standards (1989) in developing a national curriculum. Now Singapore has a much more conceptually organized curriculum, and they put more resources into math education than we do. That’s how you get your dividends.
There’s also been an increase in the number of U.S. students taking algebra in grade eight. Students who are accelerated into algebra are doing better, but students who aren't learning algebra might be getting a watered-down curriculum. This tracking won’t explain what’s happening in grade four, but it might explain the gap between the highest- and lowest-performing students in grade eight.
Another possible explanation might be the increasing shortage of teachers, and the reduction in the number of teachers who go through a formal undergraduate training program.
Ferguson: There is definitely a shortage of teachers in science education as well. At the elementary level, teachers are more generalists than science specialists, and many are not as confident in their science abilities.
As with the math scores, there are also extremely wide gaps in scores by race, ethnicity, and school poverty. The huge poverty gap, as measured by the percentage of students in the school eligible for the free and reduced-priced lunch program, was the biggest surprise. In grade eight, for example, students in schools with the lowest level of poverty (less than 10 percent eligible for the free and reduced-price lunch program) scored 79 points higher, on average, than the overall U.S. average, while students in schools with the highest level of poverty (75 percent or more eligible for the free and reduced-price lunch program) scored 62 points lower, on average, than the U.S. average.
Policymakers should be concerned about the science trends. Students need to participate more in hands-on science activities, with more access to science in the lower grades. The lower grades are very important, because they set the foundation for improvement in the upper grades. Educators and policymakers need to pay particular attention to instructional time and activities in the lower grades. It may be worse with COVID—most schools needed to shift to virtual instruction during the pandemic. I think the score gaps are really going to be exacerbated by this. With limited time for instruction, math and reading are probably what teachers are going to focus on, and science will be left out.
In addition, there’s a huge push now for computer science as a leading STEM (science, technology, engineering, and math) subject. The idea that everyone should have access to coding puts under-resourced schools at even more of a disadvantage.
Q. Are there any surprises in the TIMSS data?
Johnston: There are no significant differences between boys and girls in eighth-grade math or science. That’s a surprise to me. In math, boys in the U.S. and most other education systems have a relatively strong advantage in fourth grade. Girls caught up by eighth grade. In science, 2019 was the first year in which there were no significant score differences between eighth-grade girls and boys in the U.S. In math, this is a longer-term pattern: There were significant score differences between eighth-grade girls and boys in the U.S. only in 1999 and 2003.
These results raise questions. Is this happening because boys stopped paying attention or got disaffected and girls didn’t? Or is it because girls’ achievement rose and boys’ didn’t rise as fast—or even dropped?
Ferguson: This data about girls’ and boys’ eighth-grade achievement is very exciting. There’s been an increase in the representation of girls doing STEM, such as the Girls Who Code initiative; the Hidden Figures movie, where you can see African American women who contributed to STEM; and even commercials that show women in STEM. With representation increasing, we can also look at unconscious bias, this idea that we believed for so long that boys are more likely to enjoy STEM activities.
Q. How can education leaders and teachers use the TIMSS findings?
Ferguson: I’d investigate what is going on in lower-grade science courses—how the curriculum is addressing the standards, how science is done, and who is represented in the textbook and how to improve that. And then also think about the qualifications of teachers. When districts and schools are hiring teachers, it is important to look at which science courses they’ve taken. It is also important to think about how comfortable elementary teachers are with teaching science, and maybe provide them with more professional development or assistance.
Johnston: We haven’t helped lower-performing students advance as much as we should have. Part of that might be the mistaken idea that the goal is to get kids to pass the test, rather than to develop a deep understanding of mathematics. If we apply band-aids and tricks so students can pass the test, we’re not preparing them for later learning. The National Council of Teachers of Mathematics’ Principles to Actions distills eight research-based principles into specific teaching practices. AIR Principal Researcher Steve Leinwand led the writing team for this publication.
We need to make sure that our lowest-achieving students have the best teachers. We talk about tracking students, but we also track teachers. The best, most experienced teachers usually teach the advanced classes. We may need to move our most expert teachers to other classes to better educate currently low-achieving students to help them reach their potential.